Whether you are a Sales Manager looking for reports, or if you are the office “Power User” tasked with providing reports, you need to know about SQL queries. SQL stands for Structured Query Language and the acronym is commonly pronounced “sequel”. What does this have to do with GoldMine, reports, and Excel? Let me explain.
First, SQL provides a means for a user to send instructions and requests directly to a database. Those instructions are in the form of a SQL query. A SQL query is simply a snippet of code, a few keywords and phrases that tell the database to do something. If I were to translate for you a few examples of SQL queries into English, they might look something like this:
SQL: SELECT count(*) FROM contact1 WHERE key1=’Customer-Active’
English: “How many active customers do we have?”
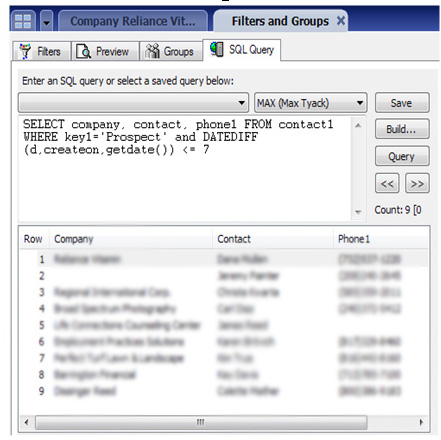
SQL: SELECT company, contact, phone1 FROM contact1 WHERE key1=’Prospect’ and DATEDIFF(d,createon,getdate()) <= 7
English: “Give me a list of new leads created in the past 7 days, with phone numbers.”
In GoldMine, you can use SQL queries like these by going to Tools->SQL Query from the main menu. The SQL query text is entered in the top window and the results display in the bottom window.
Each user can have a list of saved SQL queries under their username for future use. The results of a SQL query can be converted into a contact group for performing GoldMine operations such as printing labels, printing letters, group scheduling, and sending email blasts. A row in the results grid, when clicked on, will sync with the contact record, making for easy navigation to that contact’s record. Think of the workflow possibilities!
Now that you have a general idea about what a SQL query is and how you might use one, let’s talk about why you would use a SQL query instead of a report or a filter/group.
Reasons why a SQL Query can be better than a traditional report:
Quick to Create – Traditional reports are great if you want a whole lot of information laid out on a printed page. But inserting fields, labels and doing all of the required formatting, margins, page breaks, section headings, etc… that stuff takes a lot of time. With a SQL query, the only layout decision you need to make is what order you want your result columns to be in from left to right. That’s because a SQL query produces a grid of results, just the raw data. And more often than not, that is all you need.
Navigation – As mentioned earlier, while looking at your query results the contact record is only a click away.
Flexible Sorting – After running a SQL query you can easily sort the results by clicking on any column header.
Less Restrictive – Traditional report writers, particularly GoldMine’s native report writer, has a sort of pre-defined set of rules you must follow. You are limited as far as what parts of the database you can include in a single report. In a GoldMine report are limited in how you relate and sort data. With a SQL query, your boundaries are much less confined.
The WHOLE DATABASE is accessible via a SQL query! You can pull user activity, contact information, details, custom fields, cases, opportunities, projects, relationships, etc….
And now the BIG ONE…
Output To Excel – After you run your SQL query just right-click on the results and select Output To-> Excel. As a database professional, I can’t count how many times I’ve gotten requests like “Max, I created this great GoldMine report and it’s perfect. But the boss wants it in Excel. How can I do that?” Unfortunately, I have to answer “You can’t.” I would say at least half of the report request that come across my desk end up being SQL queries. I write a SQL query that extracts from GoldMine the data the user is looking for, then the user is free to shoot that data over to Excel for further filtering, formatting and manipulation.
Four Easy-to-Use Excel Tools with Your SQL Query Results
So after you run your query and Output To->Excel… you can:
Filter – Excel filters are great. Filters turn the column header into a drop-down box which is a pick-list of what you want to show or hide. So I will often create a SQL query to return rather broad results, giving the user the flexibility of filtering in Excel.
Chart – Say you have a SQL query that aggregates totals or record counts. Like this:
You can then output to Excel and easily create charts:
Ok, so SQL queries are good. How do I get started?
Learning how to write SQL queries, just like learning any language, takes some time and effort. There is a learning curve. But the learning curve is no worse than learning any other reporting tool like GoldMine’s report writer or Crystal Reports. And SQL is a universal language understood by almost all databases in existence. So it is a good resource to be familiar with because it has such broad application. You will need to also learn a bit about the structure of the GoldMine database tables and where the data is stored.
I host a webinar called “An Introduction to Microsoft SQL Queries and SQL Reporting Services”. This webinar has a SQL 101 section and then demonstrates live, in GoldMine, how to create and run SQL queries with many examples. I share with you a few excellent free resources for GoldMine’s database documentation. I even show you how to build your own queries without having to write a single line of code. I also showcase SQL Reporting Services which is a natural “let’s take it to the next level” place to go.
We also offer “The GoldMine Guide to SQL Queries”. This is probably the best DIY resource with everything you need to know to get started with writing SQL Queries for GoldMine.


